

 Google Sign In

EDIT
Question layouts
In this guide you will find different ways that the 1KA tool offers to design or lay out your questions. From drop-down lists to tables. Below you will find first a list of question layouts, followed by descriptions and examples.
Clicking on a specific item from the list will take you to the desired content.
- Vertical Layout
- Vertical - Text on the Left Layout
- Horizontal Beside Question Layout
- Horizontal Below Question Layout
- Dropdown Layout
- Image Type of Question Layout
- Visual Analog Scale (VAS) Question Type
- Image Hotspot Layout
- Conformation Layout
- Classic Table Layout
- Double Grid Table Layout
- Semantic Differential Layout
- One Against Another
- MaxDiffSI
- Yes/No Table
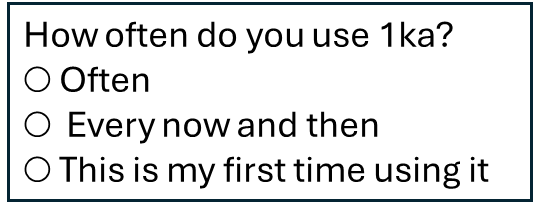
1. Vertical Layout
The vertical question layout is available for the following question types: Categories - Single Answer, Categories - Multiple Answers, and Text.
To set this layout, go to the question settings on the right side under the 'Basic' tab and select 'Vertical' for the 'Layout' option.
2. Vertical - Text on the Left Layout
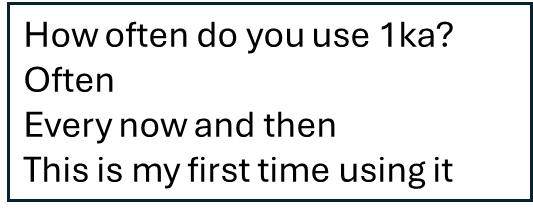
The vertical question layout with text left is available for the following question types: Categories - Single Answer and Categories - Multiple Answers.
To set this layout, go to the question settings on the right side under the 'Basic' tab and select 'Vertical - Text Left' for the 'Layout' option. This layout shifts the text completely to the left side compared to the standard vertical option.
3. Horizontal Beside Question Layout
The horizontal question layout next to the question is available for the following question types: Categories - Single Answer, Categories - Multiple Answers, Text, and Number.
To set this layout, go to the question settings on the right side under the 'Basic' tab and select 'Horizontal - Next to Question' for the 'Layout' option.

4. Horizontal Below Question Layout
The horizontal question layout below the question is available for the following question types: Categories - Single Answer, Categories - Multiple Answers, Text, and Number.
To set this layout, go to the question settings on the right side under the 'Basic' tab and select 'Horizontal - Below Question' for the 'Layout' option.

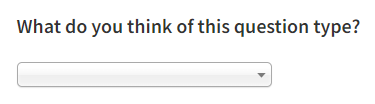
5. Dropdown Layout
By using the 'Categories - one answer' (drop-down menu) type of questions, we enable the respondents to choose one answer between several possible answers (categories). The answers are presented in the form of a drop-down menu instead of buttons. It is advisable to consider the possibility that we did not anticipate all possible responses/answers and, if necessary, add the category 'other' to the question, but with this type of question we can not enable the answer 'other' semi-open type in order for respondents to write their answers.
6. Image Type of Question Layout
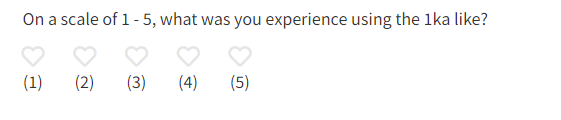
The 'Category – Single answer' and 'Table - Single answer' question types enable the use of image layout. With this layout, you can present the question graphically. You can choose the 'Image type' layout in the 'Basic' tab of the question settings, next to the 'Layout' option in the question editor. Additional settings will be available at the bottom of the settings menu:
- Type of image: you can choose between a star, thumb, smiley, heart, flag or user.
- Number of answers: select the number of possible answers (number of stars, thumbs, smiley faces, hearts, flags or users).
If desired, you can use a similar layout type, the Visual Analog Scale (VAS), for your graphical question display. This layout allows responses to be displayed on a scale with various visual responses (emoticons). In this type of layout, the emoticons can also be of different colors.
To set this layout, select the VAS option in your question settings to enable the visual representation of answers.
7. Visual Analog Scale (VAS) Question Type
You can include the 'Visual Analog Scale' question type in your questionnaire, which can be found among the layout options for the 'Categories - Single Answer' question type. The Visual Analog Scale (VAS) allows responses to be displayed on a scale using visual representations (emoticons).
To set up this question:
- Add a 'Categories - Single Answer' question to your questionnaire.
- In the question settings on the right side, under the 'Basic' tab, select 'Visual Analog Scale' for the 'Layout' option.
- An additional setting for 'Number of Responses' will appear on the right, where you can choose between 2 and 7 responses.
Example:
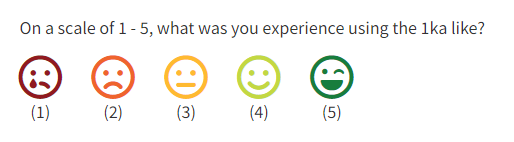
This setup allows you to visually represent the responses on a scale, enhancing the engagement and understanding of the respondents.
8. Image Hotspot Layout
You can include the 'Image Hotspot' question type in the questionnaire, which can be found among the layout formats for the 'Categories - Single answer', 'Categories - Multiple answers' and 'Table - Single answer' question types. The question allows the question to be set in the form of an image and the respondent answers by marking one or more points or areas on the image.
Setting up an Image Hotspot question:
- To create a Hotspot question, first select the 'Categories - Single answer' from the set of all questions.
- On the right hand side of the question settings under 'Layout', select 'Image Hotspot'.
- Upload an image using the icon that appears within the question.
- In the question settings, the 'Add a region' button appears (under Regions - Answers).
- This will open the edit zone window where you can use the left mouse click to highlight the region in the image. You can use the right mouse click to delete the region points you have already entered. By holding down the left mouse button, you can move the already entered region points. When you are happy with the region you have created, enter a name for the region and click 'Confirm'. You can add multiple regions.
Additional settings:
- Color of selected region: specify how the region selected by the respondent should be colored.
- Illumination: select the type of illumination or the way the regions are visible or invisible to the respondents.
- Always: all set regions are visible;
- On mouseover: the region is highlighted when the mouse is hovered over the region.
- Hint: select the options for displaying hints (answers) with the names of the regions.
- Show on mouseover: the hint is visible when hovering over the region;
- Hide: the hint (answer or region name) is not visible.
Example of a survey using Image Hotspot >>
9. Confirmation Layout
The 'Confirmation' Layout is used to verify whether the respondent has correctly entered the data previously provided in the survey. It is typically used for cases where it is important for the respondent to input information accurately, such as email addresses, phone numbers, or other sensitive data. This option can also be selected among the layouts, allowing the respondent to confirm their choice (e.g., registration, response, etc.).
10. Classic Table Layout
The basic and default table layout allows us to create a standard table with a customizable number of columns and rows appearing beneath the question. This table layout is used when no specific customization is required, and a straightforward response from the respondent can be effectively captured using the classic version of a single-answer table.
11. Double Grid Table Layout
A 'Double Grid'' table is useful if you want the respondent to answer the same set of questions by two different criteria, for example importance and satisfaction. Create it in the 'EDIT' – 'Questionnaire' tab from the menu on the left (click on the blue '+'). In the list of All questions that opens, under the category 'Single answer tables', select 'Double grid table'.
When editing the question, you can specify the subheading of each scale in the right-hand side menu, in the '1st table subtitle' and '2nd table subtitle' input boxes in the 'Answers' section. Under these subheadings, you enter the values of each category in the table, e.g. from 1 to 5.
Example: you want to know how satisfied respondents are with the design and quality of different products. You would write 'How satisfied are you with ...' in the text of the question, '... with the design?' in the subheading of Table 1 and '... with the quality?' in the subheading of Table 2. For both sub-tables (columns), mark the values from 1 to 5 and write the names of the products in the rows.
Example of a survey with double grid table >>
12. Semantic Differential Layout
The semantic differential is a bipolar evaluation scale, with two opposing adjectives or response values on each side of the scale, e.g. happy/sad, very attractive/not attractive at all, very likely/not likely at all, etc. The semantic differential can be used to measure the respondent's attitude towards ideas, concepts, things, people and events.
Semantic differential as a table
To create a semantic differential in the 1KA tool, when editing a questionnaire, click on 'Add question' in the 'EDIT' – 'Questionnaire' tab (or on the plus sign in the menu on the left) and select 'Single answer tables - Semantic differential'. Enter the corresponding opposite adjectives on the left and right side of the radio buttons.
An example of a survey using a semantic differential >>
13. One Against Another
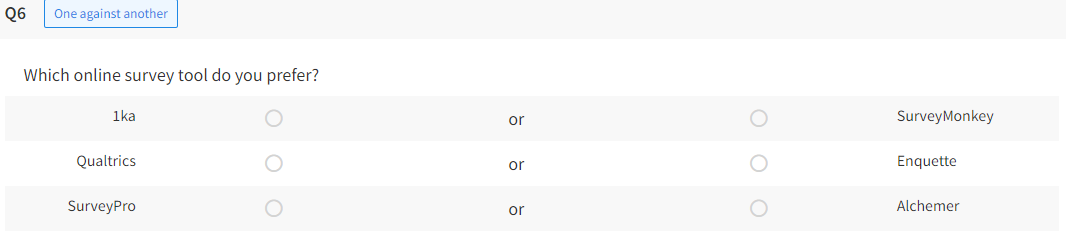
In the 'EDIT' – 'Questionnaire' tab, when editing 'Table - Single Answer' questions, you can select the 'One Option Against Another' layout. This approach is used to compare two different options and determine which option respondents prefer or find more important.
To create a 'One Option Against Another' table:
- Enter a 'Table - Single Answer' question type.
- On the right side in the question settings, under the 'Layout' option, select 'One Option Against Another'.
- The table will transform into two columns separated by the word ‘or’ in the middle, with each column containing one of the options that respondents can choose between.
Example:
14. MaxDiffSI
In the 'EDIT' - 'Questionnaire' tab, you can select the Max-Diff layout when editing 'Table - Single answer' question types. The Max-Diff table is an approach used when you want to find out the preference/importance of several different factors (e.g. purchase of a new mobile phone, brand image, product features). This approach is mainly used in marketing research.
The Max-Diff table is created by first adding the usual 'Table - Single answer' question type and then selecting 'MaxDiff' in the question settings on the right-hand side when setting up the question. The table will be transformed so that the answers (e.g. factors, attributes) are in the middle of the table and the left and rightmost categories are where the respondent will use the radio button to select the answer/factor/attribute that is most or least important to them.
By default, the category outliers are named 'Most important' and 'Least important', but you can rename the category by clicking on the category name.
Example of a survey with a MaxDiff question type >>
15. Yes/No Table
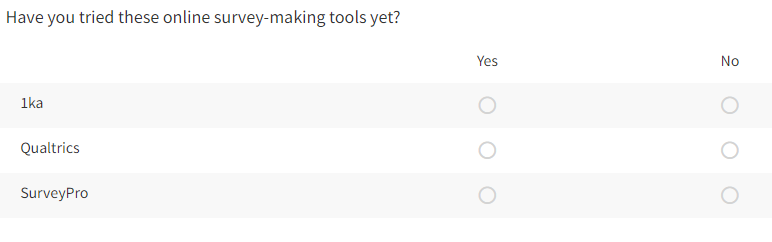
In the 'EDIT' – 'Questionnaire' tab, when editing 'Table - Single Answer' questions, you can select the 'Yes/No Table' layout. This layout is useful for determining if respondents have used certain functions, are familiar with specific applications, or agree with certain statements. It provides a clear and straightforward overview of the respondent's choices.
To create a 'Yes/No Table':
- Enter a 'Table - Single Answer' question type.
- In the question settings on the right side, under the 'Layout' option, select 'Yes/No Table'.
- The table will transform into two columns, one under the word 'No' and the other under 'Yes'.
Notification Settings
The video guide shows how to adjust the notification settings in the 1KA application.
Basic Survey Settings
The video guide shows the basic survey settings in 1KA.
Link to the mentioned video guide: Multilingual Survey
Settings for exporting PDF/RTF files with answers
The complete survey as well as a printout of the respondents' answers can be exported from the 1KA tool in PDF or RTF format. The PDF option can also be used in the conclusion of the survey, where each respondent can export their answers, or you can set up notifications for survey completion, where each respondent is provided with a link to their a PDF of their answers.
In the 'EDIT' - 'Settings' - 'PDF/RTF export' tab, you can set the individual printouts.
For the survey printout, you can set whether the numbering of the questions is displayed, whether the IF conditions are displayed and whether the introduction is displayed.
When printing out the answers of the respondents, you can set whether a short or an expanded layout is used. You can set the numbering of the questions, the display of the recnum (sequence number of the respondent) and the display of the IF conditions. You can set that questions and sub-questions that do not contain answers are not displayed. If you want to export answers for multiple respondents at once, you can set each respondent to be displayed on a new page.
If you are not satisfied with the PDF output of the questionnaire or the respondent's answers, we recommend exporting to RTF format, which can be reformatted as you wish.
The functionality is available for users of the 2KA and 3KA packages for individuals, and for users of the business packages for groups.
Related content
- Video guide: Exporting Questionnaire and Data to PDF and Word
Website Evaluation
The video tutorial shows how to create a 1KA survey where the respondents will be shown a certain website on half of the screen and the survey we created in 1KA on the other half.
Inserting Images Into Your Questionnaire
You can insert images in your questionnaire in the 'EDIT' – Questionnaire' tab:
1. You can add an image in the question or answer text:
- If you want to add an image to the question text, click on the 'A' icon for advanced text editing, which appears to the right of the question text when you move your mouse over the text.
- If you would like to add an image to an individual answer, click on the pencil editing icon to the right of the answer text, where you will automatically be taken to the advanced text editing screen.
2. In the new window - the advanced text editor - click on the icon to add an image. In the 'Image Properties' window, you can enter the URL of the image you want or click on the 'Upload File' button to upload an image from your computer.
3. If you want to add an image from your computer, a new window will open. Select the desired image from the directory on your computer and then click 'Open'. In the 'URL' input field, the URL of your image that has been uploaded to the 1KA server will automatically be displayed - wait for a few moments so that the image can be uploaded first, after which the URL will be generated. You can also set the layout and size of the uploaded image as you wish. Add it to the question/answer by clicking on the 'OK' button.
4. Hiding radio and checkbox buttons
For the question types 'Categories - Single answer' and 'Categories - Multiple answers', an additional option 'Hide radio/checkbox buttons' is available. This functionality is useful for adapting the survey to mobile devices, especially in the case of image-based answers. In this case, you can hide the radio buttons (radio or checkbox) and the respondent who will be completing the survey on a mobile phone will select the answer by clicking on the image.
Example of a survey with hidden radio and checkbox buttons (mobile preview) >>
Related content
- Video guide: Inserting Images
- Questionnaire
Creating Respondent Groups
If you want to analyse specific groups of respondents but do not want to ask questions to identify them, you can create groups before you send out the survey. For example: if you want to distinguish between companies or their employees, create a group for each company (company A, company B, company C).
You can create groups in two ways:
- 'EDIT' – 'Settings' – 'Respondent access' – 'Access with password': In the 'Access with password' you can create your own password for each group. This will create a new variable 'Password' that has the password categories (example: company A has the password ***1, company B has the password ***2, etc.).
- 'EDIT' – 'Settings' – 'Groups': With this functionality, you can also create as many groups of respondents as you like, except that each group is given its own URL, which you pass on to a specific group (example: each company gets its own URL for the survey).
Data from all groups is recorded in a single database, and a new variable is created within the database for the groups, which can be used to identify them in the analysis. Both group functionalities work in a similar way to languages. One of the advantages is that you can also set conditions according to the groups within the questionnaire, so you can set which question is shown to which group. Similarly to languages, you can also use groups in conditions. The variables 'group' and 'password' are available in the condition setup dialog, but only if at least 2 groups of respondents are defined in the questionnaire.
The functionality is available for users of the 2KA and 3KA packages for individuals, and for users of the business packages for groups.
Related content
The Use of Conditions
Conditions or branches (IFs) are used to ensure that only certain people answer certain questions. You can also set multiple conditions for a question or set of questions, grouping and nesting them.
1. Basic conditions
Basic conditions can be set for one or more questions, where the condition specifies the answer to one of the preceding questions or a combination of several answers. Alternatively, conditions can be set so that they are determined by random grouping or computations.
You can set the conditions while editing the questionnaire in the 'EDIT' - 'Questionnaire' tab:
- Click on the blue IF icon located in the left side menu.
- Move the start of the condition before the first question that you want only certain respondents to see (but after the question on which you will base the condition).
- Select the variable that will be the basis for the selection in the drop-down menu.
- In the next drop-down you can also change the way the condition is calculated: equal (=), not equal (≠), greater (>), greater than or equal to (=>) less than (<) and less than or equal to (<=).
- On the right, you then select (categories/answers) or enter (if it is an open question) the value for which you want the questions in the condition to appear for respondents.
- Finally, move 'ENDIF' after the last question that you want to be included in the condition (to be answered only by the respondents who match the condition you have set).
Example: if you want all those who answer NO to the first question (Q1) to skip to the end of the survey:
- Set the start of the condition ('IF') after the first question Q1.
- Set the end of the condition ('ENDIF') after the last question or before the conclusion.
- Set question Q1 as the base question for selection and the value of the condition to YES in this case. Leave the calculation operator set to the default value equal to (=).
Example of a survey with a basic condition >>
2. Follow-up conditions for the display of another question
- A follow-up condition on a question with categories intuitively and automatically creates a condition for the next question.
- By clicking on the IF→ icon, you can specify any category/answer as a condition for displaying another (usually the next) question.
Example: if you want question Q2 to be displayed if the first category, e.g. the answer YES, of question Q1 is selected:
- Start editing question Q1 and click on the IF→ icon next to the desired answer category ('YES').
- Immediately after question Q1, a new question will be inserted which will only appear for respondents who select the first category (answer 'YES') of Q1.
Example of a survey with a follow-up condition >>
3. Internal conditions - conditions for sub-questions and possible answers
- A condition does not have to apply to the whole question - you can also restrict the display of individual sub-questions (tables) or possible answers (categories).
- By clicking on the IF* icon, you place a condition on that category, i.e. you specify when that category is displayed. When you close the question editor, the answers or categories for which you have set a condition will display the condition you have set on the right-hand side.
Example: If you want the second question (Q2), where respondents rate the usefulness on a scale of 1 to 5, to show only the categories that respondents selected in the first question:
- Start editing question Q2 and click on the IF* icon next to the first statement.
- In the window that opens, you select question Q1 as the basis for the condition. You select the corresponding category as the value of the condition and leave the calculation operator set to the default value equal (=).
Example of a survey with internal conditions >>
4. Multi-criteria conditions
You can define more than 1 criterion for each of the basic and internal conditions:
- In the editing of a condition, you first create the first criterion by defining a variable and a value as the basis for selection, as described in points 1 and 2 respectively.
- You will then see an additional option at the bottom 'Add next condition';
- If you want the condition to be met if any of the criteria apply (i.e. it is sufficient that only one criterion is satisfied), click on 'OR'.
- If, on the other hand, you only want the condition to be met only if all the criteria of the condition are met, click 'AND'.
- You can also use the 'OR NOT' and 'AND NOT' options in case you want to set the condition to be met when it does not match the set criteria.
- On the left ('Brackets') and right ('Brackets') of each variable are icons in the form of '+' and '-' characters, which can be used to edit the brackets to ensure the correct order of computational operations for complex sets of condition criteria.
Example: you only want to show the third question (Q3) to those who answered YES to the first (Q1) or second (Q2) question:
- Set the start of the condition ('IF') after the second question (Q2):
- Set the end of the condition ('ENDIF') after question Q3.
- Set Q1 as the base for selection and the condition value to YES. Leave the calculation operator set to the default value equal (=).
- Then select 'OR' at the bottom of the 'Add next condition' line.
- Define a second condition criterion, selecting Q2 for the selector and setting the value of the condition to YES. Here again you leave the computation operator set to the default value equal to (=).
Example of a survey with conditions based on several criteria >>
The functionality is available for users of the 2KA and 3KA packages for individuals, and for users of the business packages for groups.
Related content
- Questionnaire
- Video guide: Basic Use of Conditions
Use of ‘Location’ Question Type
In the set of all question types, in the 'Special questions' section, you can find the 'Location, GPS' question type. This question type has three ways of entering a location: 'My location', 'Multi location' and 'Choose location'.
My location
'My location' allows you to identify the current location of the respondent. The focus on the map is pre-set to Slovenia, but can be changed by clicking on the 'Set focus' button on the map to make the map clickable, so you can use your mouse to set the desired focus. In the question settings, the option to query the current location and display a search window is pre-set. The user can also activate the display of a sub-question, which appears as a marker on the map with an input field.
Example of 'My location' question subtype >>
Multi location
'Multilocation' allows the respondent to mark several places on the displayed map. The question is particularly useful when asking the respondent for more than one location, e.g. which places they have visited in the last year. This option is accessed by selecting the question 'Location, GPS' and selecting 'Multi location' from the three 'Subtype' options given.
The focus on the map is preset to Slovenia, and the search window display is also turned on by default. The maximum number of possible answers is pre-set to three (3), which the user can change using the drop-down list, and can also turn on the display of the sub-question, which will appear as a marker on the map with an input field.
Example of 'Multilocation' question subtype >>
For both location input options, two columns are created in the data table: 'Address' and 'Coordinates', and if a subquestion is configured, a 'Value' column. The entered or selected addresses and coordinates are in the form of a link to a pop-up window with a map and a marker for each respondent. The results in the analyses are displayed in a similar way, except that there is also a 'Google maps' icon in the leftmost cell, which acts as a link to a pop-up window with a map of all the responses/markers for each variable.
Choose a location
The 'Choose location' option provides the respondent with pre-marked values or points on the map where they can enter their answer. This option is accessed by selecting the question 'Location, GPS' and selecting 'Choose location' from the three 'Subtype' options given. This question type is useful when the survey editor wants to illustrate a specific route and several locations on a map. The question allows the survey editor to add values or markers by clicking on the map, and with the map toolbar, the survey editor can draw on the map. They can start by marking places on the map with clicks, and continue drawing the route by clicking on the 'Hand' button and then clicking on the map where he wants the route to go. With more clicks, they can make turns and mark the route accurately. When they click the 'Hand' button again, they finish drawing the route. A box appears to enter the name of the route and a 'Delete' button appears to delete this marked route. The legend explains that the 'Hand' button means finish drawing, the 'Marker' button adds a marker and the 'Line' button adds a line. For marker and line, as mentioned, a title can also be added to serve as additional information or a label. It should be noted that the line is not a value, but only additional information to the respondent (e.g. illustrating several possible routes). As with the Multi Location - Marker Entry sub-type, a sub-question can be added in the settings. The results are displayed as coordinates in the data table.
Example of 'Choose a location' question type >>
The functionality is available for users of the 2KA and 3KA packages for individuals, and for users of the business packages for groups.
Related content