
Statistike

Break

If you click on the 'ANALYSE' – 'Statistics' tab and select 'Break' from the drop-down menu ('Select:'), you can generate analyses based on a single independent variable.

Select the independent variable (e.g. gender) from the newly displayed drop-down list and the analysis of all the questions in the survey will be displayed in the form of bivariate tables. The results for each question are displayed according to the variable selected (e.g. each table shows the responses for each question, with answers separated by the gender of the respondent).

By default, the results are displayed as frequencies, if you want to display them as percentages then select the 'Percentage' option, and you can also choose to display the analyses as tables or graphs (option to the right of the drop-down menu).

2KA and 3KA package users as well as users of the business packages for groups can export each individual 'Break' table to PDF, MS Word or MS Excel formats. These users can also analyse statistics with advanced analysis options and filter them according to segments, zoom, groups, variables, conditions, missing values, time period and unit status.


Some of the functionalities described are only available for users of the 2KA and 3KA packages for individuals, and for users of the business packages for groups.


Related content

Granting Survey Access to 1KA Helpdesk

Protecting user data is one of 1KA's top priorities. Access to data is limited to the author (editor) of the survey and additional co-editors, which are added by the author of the survey.

1KA's helpdesk and the website administrator of www.1KA.si do not have access to surveys and data without the explicit consent of the user.

In case the user requires assistance from 1KA’s administrators, the user must grant temporary access to 1KA's helpdesk (until the issue is resolved). Despite granted access, administrators are still committed to the highest standards of privacy protection, as defined in the Terms of Use.

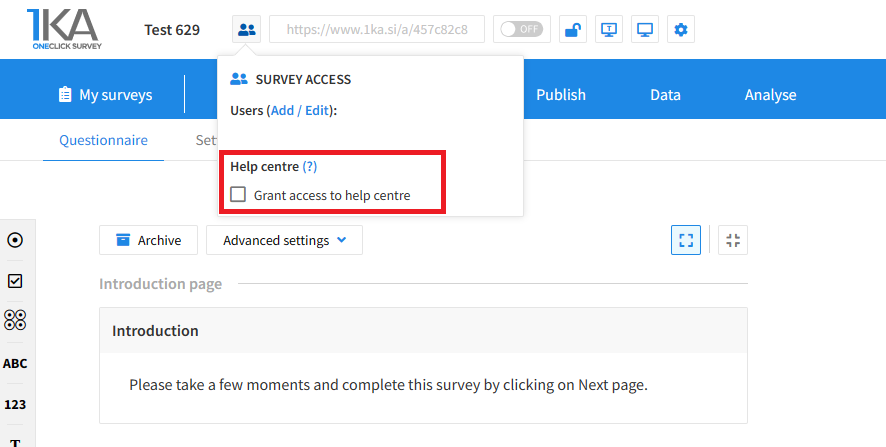
Each survey has an icon in the top left corner which enables you to grant access to 1KA's helpdesk and administrators. You have to click 'Grant access to help centre'.

Grant access to help centre
 

The author can add co-editors in the tab 'EDIT' – 'Settings' – 'Editor access'.

Related content

Basic data analysis

Basic data analysis can be performed directly in the application, in the 'ANALYSIS' - 'Statistics' tab. Here you can see the following analyses:

  • 'Summary': The summary shows a summary of the analysis of your survey and is also automatically generated when you open the 'Statistics' sub-tab.
  • 'Descriptives': Descriptive statistics such as number of units, mean, standard deviation, minimum and maximum are displayed for each variable.
  • 'Frequencies': For each variable, you will see the frequencies of the responses, i.e. the number of times that response was selected. 
  • 'Crosstabs': These are contingency tables: first you select the independent variable, then the dependent variable. The analysis will show the overall results and indicate if there is a correlation between the two variables or not. 
  • 'Multitables': This is a multidimensional table of categorical variables. You can select several variables and the table will show the overall results.
  • 'Means': With this option you can calculate means by group. First select the independent variable, or define it as a category, and then select the dependent variable. 
  • 'T-test': Allows you to test hypotheses about statistical differences between two variables.Only available for users with administrator status.  
  • 'Break': The analysis is broken down according to the control variable. Select the variable you would like to control or break your data by from the drop-down list.

Users of the 2KA and 3KA packages for individuals and users of the business packages for groups can export the results of certain analyses in PDF, MS Word or MS Excel format. Alternatively, you can create a public URL that you can share with any number of people to allow them to see these results/analyses, but this does not mean that they have access to your survey. You can also include each table or graph in a 'Custom Report'. Custom Reports are only available to users of the 3KA package for individuals, and users of the business packages for groups.


Some of the functionalities described are only available for users of the 2KA and 3KA packages for individuals, and for users of the business packages for groups.


Related content

1KA is free to use for basic users