TESTIRANJE

Survey preview

When editing a survey in the 'EDIT' - 'Questionnaire' tab, you have the option to preview the survey before the survey is activated. To open the preview, click on the 'Preview' button at the top of the page. This allows you to check the order of the questions, the functioning of the conditions and warnings, etc. In preview mode, no data is saved.

To preview the survey in the basic view, select 'Computer'. If your survey will also be answered on mobile devices, there is also a preview for mobiles and tablets.

Regardless of the preview device you choose, you can switch between devices within the preview page by selecting the device you want from the menu on the right.

Additional settings are also available in the preview for easier viewing:

  • Disable verification of conditions and alerts;
  • Display conditions and blocks above questions;
  • Display variable names.

In the case of longer surveys where you have a large number of pages, you can also use the 'Jump to page' option, where you can select the page you want to see in the preview.

Example of a survey in a preview mode >>


Related content

Measurement and Time Limitations for Responses

For each variable, you can limit the time available for entering a response. This can be done in the 'Advanced' tab in the question settings (in the 'EDIT' – 'Questionnaire' tab), where you can select 'Time limit for answering (Timer)' and set the display time for that question. Only one timer can be set for each page. When the time is up, the survey will be redirected to the next page automatically, regardless of whether there are other questions that do not have a timer on the previous page. We therefore recommend that if a timer is set, you add a page break after each question.

Pending the next application update, it is currently not possible to utilize the timer feature in cases where the timed page is followed by a page with a question that's not visible to all respondents (eg. due to group randomization or other IF conditions). Depending on the individual survey design and methodological needs, consecutive timed pages with separate conditions may instead be interspersed with pages visible to all respondents (in cases where question order is not imperative), or all timed questions within conditions can be grouped on one page (in cases where each respondent is only shown one question out of a pool of multiple questions).

If you wish to measure the answering time for each question, you must also create a separate page for each question, since time is only measured for each page. You can enable paradata in the 'DATA' – 'Browse' tab ('+ Show columns' - 'Respondent paradata') to record, in addition to the survey data, the date and time at which the respondent arrived at a particular page of the questionnaire.

In the table with the respondent units, we then have the date and exact time of completion according to the individual pages of the survey:

  • Date:
    • Begin: the exact date and time (hours, minutes and seconds) when the respondent opened the survey page (click on the URL of the link to open the survey);
    • End: The last time the respondent was active on the survey, excluding the outro page;
  • Page 1: date_1: Exact time when the respondent clicked on the "Next page" button on page 1;
  • Page 2: date_2: Exact time when the respondent clicked on "Next page" button on page 2;
  • Page n: date_n (n = number of pages): Exact time when the respondent clicked on the "Last page" button on page n;
  • The time of the outro page (end of the survey) is not visible.

The average page times are listed in the 'TEST' - 'Duration' - 'Actual time'.


Related content

Test Insert Survey

To test the questionnaire, you can use the Test Insert function, which allows you to complete the questionnaire in a test environment. The answers are saved so that they can be used to check the functionality of analyses, data views, etc. At the same time, the answers are marked as test data and can be easily deleted with a single click.

Test respondents can turn off the checking of conditions and warnings, display conditions and blocks before questions and display variable names when completing the questionnaire. For users of the 3KA package for individuals and  users of the business packages for groups, comments are also available for test respondents to comment on individual questions during the completion process. 

The 'Test Insert Survey' link is displayed in the 'TEST' - 'Diagnostics' tab and can also be accessed by clicking on the 'Test Insert Survey' icon at the top of the page:


Some of the functionalities described are only available for users of the 3KA package for individuals, and for users of the business packages for groups.


Related content

Comments

Below is a description of how you can add and manage comments in 1KA, how survey editors add comments and how respondents add comments.

1. Comment settings

To enable comments, go to the 'EDIT' – 'Settings' – 'Comments' tab. You can also access comments by clicking on the dialog box via the blue icon on the right (under your profile name) or in 'TEST' – 'Comments'.

In the comment settings, we have the option to turn on comments:

  • general editor comments,
  • editor comments for each question,
  • general comments of respondents in the test survey,
  • respondent comments for each question in the test survey.

By clicking on the 'Show advanced settings' button, you can also set the default settings for the preview and test input, the input field for authors' comments on the survey, the notes for each question in the comments tab, the input field for authors' comments on each question, an additional window under the questions for respondents' comments, additional settings for respondents' comments and the comments in general. After selecting the settings, you should always click the 'Save changes' button. In this section, you can also delete all comments from your survey.

In the 'MY SURVEYS' - 'SETTINGS' - 'User settings' tab, users can set comments to be on by default when creating a new survey. More >>

2. Adding comments

Comments can be added in the test view of the survey, which can be accessed via the blue icon (screen with the letter T) to the right of the survey URL at the top of the screen and in the 'TEST' – 'Diagnostics' tab.

Depending on your settings, you will see boxes to enter comments: either under each question or for the whole survey. If you want comments from the respondents, you need to provide them with the URL of the test view of the survey. Editors can add comments to questions in the 'EDIT' – 'Questionnaire' tab. Under a question, condition or block, click 'Add comment', write your comment in the box and click 'Comment'.

3. Viewing comments

To see the comments on the survey, click on the 'TEST' – 'Comments' tab. You can also access the comments by clicking on the speech bubble icon located on the right hand side under your profile name.

You will see all the questions that have comments, with editors' comments on the left and respondents' comments on the right. You can edit and correct questions in the interface by simply clicking on them. You can also reply to comments here. Once the comments have been reviewed and possibly taken into account, you can 'Resolve' them to hide them from the default view of only unresolved comments. By clicking on 'Add a question comment', you can respond to comments made by the survey editors.


The functionality is available for users of the 3KA package for individuals, and for users of the business packages for groups.


Related content

Satisficing in Surveys

Respondents' behaviour during the survey is influenced by various factors: the complexity of the questionnaire, the respondent's ability and the respondent's motivation. In long surveys, respondents often become tired, disinterested, impatient and distracted when completing the survey. This can lead to the respondent starting to answer according to the satisficing theory. Satisficing is an alternative form of behaviour of respondents who lack engagement but still participate in the survey for various reasons (e.g. contract, rewards, feelings of shame, habit, curiosity, etc.).

Whether respondents are completing the survey on a satisficing basis can be identified through various response patterns: the choice of the first answer, the choice of the middle values, the choice of the last answer, random choices, the choice of the final and first values for matrix questions (tables) and the use of the answer 'Don't know', the time of completion of the survey, etc.

Approaches to Reducing Satisficing in Surveys

1. Before data collection:

  • If possible, keep the questionnaire short, keep the questions simple and occasionally include questions where respondents are asked to explain their answer. Put the more important questions at the beginning.
  • Motivation of respondents can be increased by emphasising the importance of the study.
  • We make the survey easier for respondents by reducing the complexity of the wording of questions, avoiding questions about events that would be harder for respondents to recall, rewording complex questions into multiple questions, naming all answers.
  • The satisficing effect can also be reduced by randomising the answers, avoiding table-type questions and questions with non-content answers.

2. During data collection:

  • At the time of data collection, we can monitor the time taken to complete the survey, which, in the event that the survey is completed significantly faster than expected, indicates the possibility of satisficing-based completion. It should be borne in mind that fast completion is not necessarily an indicator of satisficing.

3. After collecting data:

  • After the data collection period, we can remove answers or even whole units from the analysis (or use data insertion methods) where we observe satisficing to improve the quality of the data.

Your First Survey

After you have successfully registered on 1KA's website, you are able to create your first survey.

1. CREATING A SURVEY

You can create a survey in the 'My surveys' tab by clicking on 'Create Survey'. Choose a name for your survey, which will be displayed in your directory, as well as the name that will be visible when the survey is published (to the respondents) – the names can also be identical. You can also select the primary language for the respondents, i.e. which language the basic options should use (next page, back, end of survey …). In order to create a short survey, click on the option 'Survey'. If you wish to create a form, click on the option 'Form', while for voting you must click on the option 'Voting'.

When you select the desired survey type (Survey), you will be automatically redirected to a page where you can edit the survey, choose from the different types of questions, and later, when you have finished collecting data, can also access the data and the analysis.

To start with, you have the option of setting socio-demographic questions, which are already pre-set in the 1KA tool. These questions are standard and are used in scientific research. The selected demographic variables can be included in the questionnaire by ticking the box next to the desired variables. 1KA positions the selected socio-demographic questions into a separate block at the end of the questionnaire. Each variable comes in various types – you can select the desired question type in the 'Edit question' sub-tab. All possible question types are found in the dropdown menu in the upper right corner of the question editor. Select the chosen type and click 'Close'.

If you don't like the default Introduction, you can simply change it by clicking on the text and enter your own introduction. The introduction should not be too long but should serve to persuade the respondent to complete the survey. For more information on how to effectively write an introduction, consult our recommendations for writing the survey introduction.

Different types of questions are available on the left side of the screen, which can be easily inserted into your questionnaire. If you navigate the mouse over each question type, an example of the question formation is displayed. The questions can then be dragged and dropped to the desired position in the survey, or you can simply click on the question type, and the question will appear automatically at the bottom of the survey.

2. TESTING YOUR SURVEY

The 'TEST' – 'Diagnostics' tab warns you of any possible mistakes and offers recommendations to improve your survey. You can include Comments and Automatic entries in your survey. Comments are only available in the 3KA package. You can test the survey with the test entries icon, which can be found to the left of the survey URL and in the 'PUBLISH' – 'Settings' tab.

3. PUBLISHING YOUR SURVEY

When the survey has been successfully created, click on the 'PUBLISH' tab, where you can activate your survey and access the survey URL. More >>

By clicking on the 'Activate' option, which is found on the left side of the screen, the survey becomes active. A new window will appear; by default, the survey will be active for a period of three months, but the time period can be adjusted in the 'Activities settings can be changed here' optionYou can set the start and end date of the survey activity or choose to make the survey permanent. In addition to the time limit, you can also set a response limit or quota here. More >>

Survey activation is also possible above, to the right of the survey URL, by clicking the OFF button.

4. DATA REVIEW

In the 'DATA' tab, you can review the collected data, and can also review the answers for each individual unit with the 'Insight' option. By default, only valid units (i.e. units where the questionnaire was partly or fully completed) are displayed. The collected data can be exported in text format or into SPSS and Excel. Data export is only available to 2KA and 3KA private package users. More >>

5. OVERVIEW OF ANALYSIS

The 1KA tool merely generates tables according to the chosen question type. In the 'ANALYSE' – 'Statistics' tab, only basic statistical analyses are displayed, such as frequency, percent, number of units, etc. 2KA and 3KA private package users also have the option of advanced analysis. More >>

The 'ANALYSE' – 'Charts' tab allows access to the graphic presentation of data. Charts are only available to 2KA and 3KA private package users. The chart type is selected based on the question type, which you can also change. The colour of the charts can also be modified. More >>


 

Related content

Granting Survey Access to 1KA Helpdesk

Protecting user data is one of 1KA's top priorities. Access to data is limited to the author (editor) of the survey and additional co-editors, which are added by the author of the survey.

1KA's helpdesk and the website administrator of www.1KA.si do not have access to surveys and data without the explicit consent of the user.

In case the user requires assistance from 1KA’s administrators, the user must grant temporary access to 1KA's helpdesk (until the issue is resolved). Despite granted access, administrators are still committed to the highest standards of privacy protection, as defined in the Terms of Use.

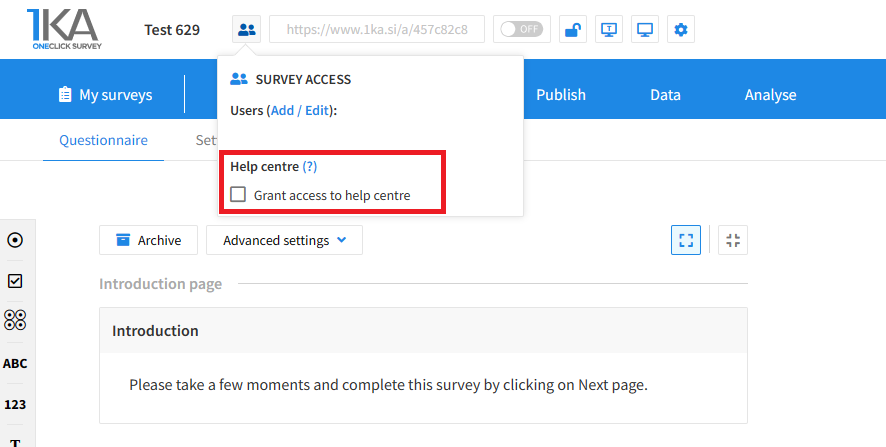
Each survey has an icon in the top left corner which enables you to grant access to 1KA's helpdesk and administrators. You have to click 'Grant access to help centre'.

Grant access to help centre
 

The author can add co-editors in the tab 'EDIT' – 'Settings' – 'Editor access'.

Related content

Survey Testing

The video guide shows how to test the survey you created in the One Click Survey application.

Testing before the final publication is a very important step in making a good questionnaire. One Click Survey automatically recognizes the shortcomings of your questionnaire and estimates its duration.


The link to the mentioned video Comments.

1KA is free to use for basic users