

Uporabni respondenti

Interruptions (BETA)

Interruption means that the respondent has stopped with survey filling at a certain point (break-off).

In the normal data collection mode of the application, 1KA data is saved for each page. Only by enabling additional monitoring of paradata variables are saved promptly. In the normal way of data collection breakoff means that all variables on a certain page of a survey where breakoff occurred are left unanswered. If respondents had already answered to question (eg. QX1) on a certain page of a survey and then left the survey, all questions on the page of question QX1 are left unanswered.

1KA generally marks unanswered questions – questions that were shown to the respondent and were then not answered by the respondent – with a value (-1). (-1) is a code for the non-response of a variable. It means that a certain question was shown to the respondent and was left unanswered because of different reasons such as not knowing the answer or overlooking the question. In a case when the respondent didn’t answer any of the questions following the first unanswered question, all other answers are marked as a (-3). That means that a serial non – response happened and the respondent did not answer any of the following questions because of an interruption. In such cases, most of the questions were not even shown to the respondent and therefore this is not a normal non-response, because the survey was interrupted before a certain question was even shown to the respondent.

If a question is added subsequently, all respondents that had answered the survey before that question was later added, are marked with (-4), except in the case of an interruption. In the case of interruption (-3) is assigned if that question is after the breakoff point. Respondent would not have answered such a question anyway, because the survey was interrupted before the respondent has reached that question. If the subsequently added question was before breakoff point, that question is marked with (-4) which means that that question was not answered by the respondent, because that question was not yet in a survey at the time of filling a survey.

INTERRUPTION ON THE LEVEL OF A WHOLE SURVEY IS MEASURED AS A PERCENTAGE OF UNITS THAT HAVE BROKEN OFF THE SURVEY IN NEXT WAYS:

1. Introduction breakoff rate – IBR

Introduction breakoff rate is a share of all units that have broken off after clicking on the introduction divided by all units that have started with questionnaire filling. Reasons for introduction breakoff are different. Some examples are characteristics of a survey (eg. sponsors), situational factors (time pressure) and specific characteristics of an invitation (eg. Frequency, time, content of introduction).

IBR = introduction breakoff / shown = (3) / shown

2. Questionnaire breakoff rate – QBR

Different causes are to blame for break-offs later in the questionnaire. Some examples include circumstances in which the respondent is at the moment (eg. Fatigue, disturbing factors etc.) and characteristics of a questionnaire (design, length, content, question types etc.). The questionnaire breakoff rate is calculated by dividing broken off units with all units that started the survey.

QBR = breakoffs (shown – introductions breakoffs) = ((3) + (4) + (5)) / (shown-3))

3. Gross questionnaire breakoffs QBR

We can also follow breakoffs of questionnaire among all units. We name this gross questionnaire breakoffs.

QBR' = QBR × (1 – IBR) = ((3) + (4) + (5)) / (shown – (3)) × ((3) / shown)

4. Total breakoff rate – TBR

Total breakoff rate expresses the share of all introduction break off and break-offs of a questionnaire with all units that started with survey filling.

TBR = (introduction breakoff + questionnaire breakoff) / Shown

5. Retention rate

Opposite values of breakoff rates are named retention rates.

Retention rate = 1 – TBR = (1 – IBR) × (1 – QBR)

ON THE LEVEL OF INDIVIDUAL ITEMS BREAK-OFFS ARE MEASURED IN THE FOLLOWING WAYS:

1. Item breakoff rate – IBR

This rate expresses the share of units that broke off in relation to all units that broke off or were exposed to the item.

IBR = breakoffs / (breakoffs + shown = breakoffs / (breakoffs + (valid + non response + non content)) = (-3) / ((-3) + (valid + (-1) + (-90, 91, ..99)))

2. Gross item breakoff rate – GBR

This rate expresses the basic cumulative share of units that broke off in relation to all non – empty units. Non – empty units are all units that answered at least one question. It is the share of units that have status (-3) with the answered item.

GBR = breakoffs / (all non – empty units) = breakoffs / (breakoffs + shown + skipped + subsequent items = (-3) / ((-3) + (valid + (-1) + (-90, 91, ..99)) + (-2) + (-4)))

3. Net item breakoff rate – NBR

Net rates are based on net growth of breakoffs and not on comulatives of breakoffs such as IBR in GBR. NBR shows most accurately where breakoff happened. In this case we mark net growth in the number of breakoffs of question Qi as a difference in the relation with last question:

DELTA(Qi) = Breakoffs Q(i) – Breakoffs (Q(i-1) = (-3) Qi – (-3) Q(i-1)

NBR = DELTA / (Breakoffs + Shown) =DELTA / (Breakoffs + (Valid + non response + non content))= DELTA / ((-3) + (Valid + (-1) + (-90, 91, ..99)))

NBR marks relative growth of break-offs at a certain item and is relevant mostly for the first variable on a certain page. Net growth of break-offs – the number of units that broke off on the page of the survey where a certain variable is located – is compared with the number of units that this variable was shown to.


Some of the functionalities described are only available for users of the 2KA and 3KA packages for individuals, and for users of the business packages for groups.

Criteria for Usable Respondents

In the table on the 'DASHBOARD' - 'Advanced statuses' - 'Usable respondents' tab, other aggregated criteria regarding responses, non-responses and missing values in the questionnaires are also available:

  • Non-substantive answers. The respondent answered the question but had chosen standard answers that are marked as invalid (e.g. -97) in the data. The respondent can also define additional categories of non-substantive answers.
  • Valid answers. This answer type defines real substantive responses, where the respondent gives an answer that meets any potential conditions (e.g. validation), excluding non-substantive answers.
  • Non-response. This category refers to item nonresponse, which serves as a basis for the calculation of the percentage of questions to which the respondent did not provide an answer, despite the fact that questions were displayed (e.i. it excludes conditions, subsequent questions, break-offs).
  • Break-offs. The respondent stopped answering the questions and left the survey before completion. Thus, certain answers are missing. The corresponding percentage is expressed as a percentage of the questionnaire which was not filled out.
  • Usable respondents. This includes fully or partially completed questionnaires. By default, it means that the respondent filled out at least 50 % of all questions that were displayed. Additionally, the percentage of questions that were not answered due to a breakoff are also taken into account. Usable responses include substantive, non-substantive and invalid answers ( e.g. - 96 'none of the above', -97 'invalid', etc.).

The above-described usability of respondents complements the analysis of the status of units, which is displayed in the 'DATA' - 'Browse' tab (when paradata is enabled). The technical statuses of the survey completion should also be taken into account:

  • completed survey (status 6 – completed survey), which is not necessarily filled out in full;
  • partially completed survey (status 5 – partially completed);
  • initial break-off (status 3 – click on the introduction, status 4 – entered the first page);
  • empty unit, i.e. questionnaire that does not have a single answer (status 5l – partially blank, status 6l – entirely blank).

The functionality is available for users of the 3KA package for individuals, and for users of the business packages for groups.


Detailed Computations of Questionnaire Usability

You can switch on the display of the detailed usability calculations of the questionnaires in the 'DASHBOARD' - 'Advanced statuses' - 'Usable respondents' tab. 

You can turn on the detailed calculations by clicking on 'Data table settings' and selecting the 'Calculations' checkbox. The table will display the values for the following calculations on the far right:

1. UNL – Unit Nonresponse Level. It is obtained by dividing the number of all variable nonresponses for each unit by the number of all variables that have been shown to this unit. Therefore, UNL for a respondent who answered all the questions in the survey is 0. The other extreme is the case where a respondent came to the end of the survey and the application recorded all variables as variable nonresponse, resulting in UNL = 1.

2. UML – Unit Missing-data Level, which represents the percentage of questions to which the respondent did not answer because they left the survey too soon (break-off). Therefore, in calculating the UML, we take into account the UBL - Breakoff Unit Level, which reflects the share of pages of the questionnaire (i.e. the share of the questions), which would have been displayed to the respondent after they had prematurely terminated the survey. For example, if a breakoff occurs after the respondent completed 10% of the questionnaire, then UBL is 0.9 or 90 %. Thus, we have data for the UNL and UBL and we can also calculate the UML:

UML = UBL + (1 – UBL) × UNL = UBL + UNL – UBL × UNL

3. UCL – Unit Completeness Level is complementary to the corresponding value of the UML:

UCL = (1 – UML) = 1 – UBL – UNL + UBL × UNL

If we take the example from the previous point with LBM = 0.9 and assume that the respondent answers to half of the 10% of the responses that were shown to him (UNL = 0.5), then UCL is 0.05 or 5%.

4. UIL - Unit Non-applicability level is calculated by dividing the total number of variables, where the condition (IF) for a given unit is not met (status -2) by the sum of the number of all variables that were shown to this unit and the total number of variables, where the condition (IF) for a given unit is not met. If the survey has 20 questions and the respondent answered 10 questions, and the remaining 10 questions were not shown because the respondent did not satisfy the condition, then the UIL is 0.5 or 50%.

5. UAQ – Unit Additional Questions is calculated by dividing the number of variables that a particular respondent was not shown because they were subsequently added to the questionnaire by the number of all variables. If a survey has 20 variables and we subsequently add 10 more variables, the UAQ for this respondent is 0.33 or 33%.


The functionality is only available for users of the 3KA package for individuals, and for users of the business packages for groups.


Granting Survey Access to 1KA Helpdesk

Protecting user data is one of 1KA's top priorities. Access to data is limited to the author (editor) of the survey and additional co-editors, which are added by the author of the survey.

1KA's helpdesk and the website administrator of www.1KA.si do not have access to surveys and data without the explicit consent of the user.

In case the user requires assistance from 1KA’s administrators, the user must grant temporary access to 1KA's helpdesk (until the issue is resolved). Despite granted access, administrators are still committed to the highest standards of privacy protection, as defined in the Terms of Use.

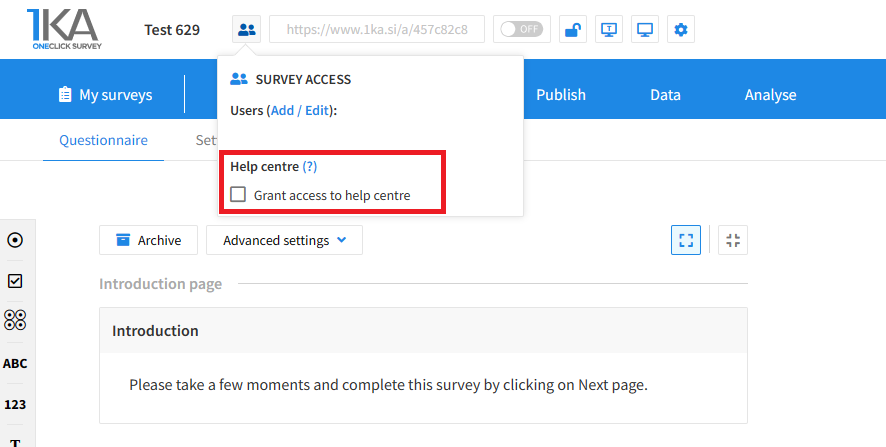
Each survey has an icon in the top left corner which enables you to grant access to 1KA's helpdesk and administrators. You have to click 'Grant access to help centre'.

Grant access to help centre
 

The author can add co-editors in the tab 'EDIT' – 'Settings' – 'Editor access'.

Related content

1KA is free to use for basic users