

STATUS

Using the IP Address and Cookies to Control Duplicate Entries

Non-list based web surveys do not enable unique identifiers, which would enable us to control duplicate entries. Therefore, we have two alternatives, IP address and cookies, however each with certain limitations.

COOKIES

A cookie is a small text file sent from the server hosting the web questionnaire and then stored on respondent devices. Next time the respondent visits this same web questionnaire, the 1KA application recognizes this unit, which can be used to prevent repeated access or to enable proper continuation from eventual pausing or breakoff.

1KA application enables a variety of duration options in terms of cookies, which can be also accessed through the 'EDIT' - 'Settings' - 'Respondent Access' - 'Completion options'When you select ‘The same respondent can complete the survey only once‘ under the ‘Multiple responses‘ option, you have following options for cookie storage duration: 

  • Until the end of the browser session‘ - where the cookie will be deleted as soon as the respondent closes their browser (Internet Explorer, Mozilla Firefox, Opera,...); so if the respondent returns within the same session, they can make further corrections. Caution: if a second respondent enters in the same session after the first respondent, the cookie will still be from the first respondent and there will be problems!;
  • 1 hour‘ - means that the cookie will be deleted after one hour from the first time the respondent clicked on the survey URL. The same warning as above (browser session) applies;
  • 1 month‘ - the cookie will be deleted after one month since the respondent first clicked on the survey. The same warning as above (browser session) applies.

You can find more about cookie settings and options for future continuation of the survey fulfilment in the Settings for respondent access: cookies and passwords manual.

Limitation: The problem with cookies is that they are tied to the browser, which means that respondents using another browser, other devices or users deleting the cookie can complete the survey again. Cookies face serious problems due to increasing ethical and legal restrictions, as well as because some users decide to block them. For these reasons, cookies serve poorly as a replacement for the ID code.

IP ADDRESS

The IP address is a number assigned to all devices logged into the network, including the respondent’s device. 1KA application enables you to block duplication of IP addresses, which can prevent the same person from repeatedly responding to your survey.

This functionality can be accessed under the 'EDIT' - 'Settings' - 'Respondent access' - 'IP recognition' tab. In the ‘IP recognition' category select the desired option - for editing responses during completion and multiple responses.

Limitation: The problem may occur in the case of dynamic IP addresses (dynamic IP address for the same device is changed when disconnected and restored) or in cases where the number of devices on the same network has the same IP address (eg. in organizations).

Despite these limitations, the use of IP blockage may prevent at least some of the simpler frauds like fake responses or server attacks coming from a single device.

In general, we do not recommend using IPs and cookies for restricting access to the survey, because they can cause various expected and unexpected problems. In the default settings of the 1KA application these options are usually turned off. Still, in some specific situations, they can be useful, particularly if we know that in our target population none of the above problems emerges.

The best way to prevent duplicate entries is to use individual codes. In the 'PUBLISH' - 'Invitations' tab, you can set individual codes through the interface for sending email invitations, which is available to users of the private package 3KA. Usually, this code is then used in the email invitation, either automatically (in the URL of the survey) and does not need to be entered by the respondent. However, we can require the code to be entered manually. Similarly, the code can be sent in other ways, e.g., in a letter, and respondents can retype it. The generation and use of individual codes is described here.
Interruptions (BETA)

Interruption means that the respondent has stopped with survey filling at a certain point (break-off).

In the normal data collection mode of the application, 1KA data is saved for each page. Only by enabling additional monitoring of paradata variables are saved promptly. In the normal way of data collection breakoff means that all variables on a certain page of a survey where breakoff occurred are left unanswered. If respondents had already answered to question (eg. QX1) on a certain page of a survey and then left the survey, all questions on the page of question QX1 are left unanswered.

1KA generally marks unanswered questions – questions that were shown to the respondent and were then not answered by the respondent – with a value (-1). (-1) is a code for the non-response of a variable. It means that a certain question was shown to the respondent and was left unanswered because of different reasons such as not knowing the answer or overlooking the question. In a case when the respondent didn’t answer any of the questions following the first unanswered question, all other answers are marked as a (-3). That means that a serial non – response happened and the respondent did not answer any of the following questions because of an interruption. In such cases, most of the questions were not even shown to the respondent and therefore this is not a normal non-response, because the survey was interrupted before a certain question was even shown to the respondent.

If a question is added subsequently, all respondents that had answered the survey before that question was later added, are marked with (-4), except in the case of an interruption. In the case of interruption (-3) is assigned if that question is after the breakoff point. Respondent would not have answered such a question anyway, because the survey was interrupted before the respondent has reached that question. If the subsequently added question was before breakoff point, that question is marked with (-4) which means that that question was not answered by the respondent, because that question was not yet in a survey at the time of filling a survey.

INTERRUPTION ON THE LEVEL OF A WHOLE SURVEY IS MEASURED AS A PERCENTAGE OF UNITS THAT HAVE BROKEN OFF THE SURVEY IN NEXT WAYS:

1. Introduction breakoff rate – IBR

Introduction breakoff rate is a share of all units that have broken off after clicking on the introduction divided by all units that have started with questionnaire filling. Reasons for introduction breakoff are different. Some examples are characteristics of a survey (eg. sponsors), situational factors (time pressure) and specific characteristics of an invitation (eg. Frequency, time, content of introduction).

IBR = introduction breakoff / shown = (3) / shown

2. Questionnaire breakoff rate – QBR

Different causes are to blame for break-offs later in the questionnaire. Some examples include circumstances in which the respondent is at the moment (eg. Fatigue, disturbing factors etc.) and characteristics of a questionnaire (design, length, content, question types etc.). The questionnaire breakoff rate is calculated by dividing broken off units with all units that started the survey.

QBR = breakoffs (shown – introductions breakoffs) = ((3) + (4) + (5)) / (shown-3))

3. Gross questionnaire breakoffs QBR

We can also follow breakoffs of questionnaire among all units. We name this gross questionnaire breakoffs.

QBR' = QBR × (1 – IBR) = ((3) + (4) + (5)) / (shown – (3)) × ((3) / shown)

4. Total breakoff rate – TBR

Total breakoff rate expresses the share of all introduction break off and break-offs of a questionnaire with all units that started with survey filling.

TBR = (introduction breakoff + questionnaire breakoff) / Shown

5. Retention rate

Opposite values of breakoff rates are named retention rates.

Retention rate = 1 – TBR = (1 – IBR) × (1 – QBR)

ON THE LEVEL OF INDIVIDUAL ITEMS BREAK-OFFS ARE MEASURED IN THE FOLLOWING WAYS:

1. Item breakoff rate – IBR

This rate expresses the share of units that broke off in relation to all units that broke off or were exposed to the item.

IBR = breakoffs / (breakoffs + shown = breakoffs / (breakoffs + (valid + non response + non content)) = (-3) / ((-3) + (valid + (-1) + (-90, 91, ..99)))

2. Gross item breakoff rate – GBR

This rate expresses the basic cumulative share of units that broke off in relation to all non – empty units. Non – empty units are all units that answered at least one question. It is the share of units that have status (-3) with the answered item.

GBR = breakoffs / (all non – empty units) = breakoffs / (breakoffs + shown + skipped + subsequent items = (-3) / ((-3) + (valid + (-1) + (-90, 91, ..99)) + (-2) + (-4)))

3. Net item breakoff rate – NBR

Net rates are based on net growth of breakoffs and not on comulatives of breakoffs such as IBR in GBR. NBR shows most accurately where breakoff happened. In this case we mark net growth in the number of breakoffs of question Qi as a difference in the relation with last question:

DELTA(Qi) = Breakoffs Q(i) – Breakoffs (Q(i-1) = (-3) Qi – (-3) Q(i-1)

NBR = DELTA / (Breakoffs + Shown) =DELTA / (Breakoffs + (Valid + non response + non content))= DELTA / ((-3) + (Valid + (-1) + (-90, 91, ..99)))

NBR marks relative growth of break-offs at a certain item and is relevant mostly for the first variable on a certain page. Net growth of break-offs – the number of units that broke off on the page of the survey where a certain variable is located – is compared with the number of units that this variable was shown to.


Some of the functionalities described are only available for users of the 2KA and 3KA packages for individuals, and for users of the business packages for groups.


Criteria for Usable Respondents

In the table on the 'DASHBOARD' - 'Advanced statuses' - 'Usable respondents' tab, other aggregated criteria regarding responses, non-responses and missing values in the questionnaires are also available:

  • Non-substantive answers. The respondent answered the question but had chosen standard answers that are marked as invalid (e.g. -97) in the data. The respondent can also define additional categories of non-substantive answers.
  • Valid answers. This answer type defines real substantive responses, where the respondent gives an answer that meets any potential conditions (e.g. validation), excluding non-substantive answers.
  • Non-response. This category refers to item nonresponse, which serves as a basis for the calculation of the percentage of questions to which the respondent did not provide an answer, despite the fact that questions were displayed (e.i. it excludes conditions, subsequent questions, break-offs).
  • Break-offs. The respondent stopped answering the questions and left the survey before completion. Thus, certain answers are missing. The corresponding percentage is expressed as a percentage of the questionnaire which was not filled out.
  • Usable respondents. This includes fully or partially completed questionnaires. By default, it means that the respondent filled out at least 50 % of all questions that were displayed. Additionally, the percentage of questions that were not answered due to a breakoff are also taken into account. Usable responses include substantive, non-substantive and invalid answers ( e.g. - 96 'none of the above', -97 'invalid', etc.).

The above-described usability of respondents complements the analysis of the status of units, which is displayed in the 'DATA' - 'Browse' tab (when paradata is enabled). The technical statuses of the survey completion should also be taken into account:

  • completed survey (status 6 – completed survey), which is not necessarily filled out in full;
  • partially completed survey (status 5 – partially completed);
  • initial break-off (status 3 – click on the introduction, status 4 – entered the first page);
  • empty unit, i.e. questionnaire that does not have a single answer (status 5l – partially blank, status 6l – entirely blank).

The functionality is available for users of the 3KA package for individuals, and for users of the business packages for groups.


Detailed Computations of Questionnaire Usability

You can switch on the display of the detailed usability calculations of the questionnaires in the 'DASHBOARD' - 'Advanced statuses' - 'Usable respondents' tab. 

You can turn on the detailed calculations by clicking on 'Data table settings' and selecting the 'Calculations' checkbox. The table will display the values for the following calculations on the far right:

1. UNL – Unit Nonresponse Level. It is obtained by dividing the number of all variable nonresponses for each unit by the number of all variables that have been shown to this unit. Therefore, UNL for a respondent who answered all the questions in the survey is 0. The other extreme is the case where a respondent came to the end of the survey and the application recorded all variables as variable nonresponse, resulting in UNL = 1.

2. UML – Unit Missing-data Level, which represents the percentage of questions to which the respondent did not answer because they left the survey too soon (break-off). Therefore, in calculating the UML, we take into account the UBL - Breakoff Unit Level, which reflects the share of pages of the questionnaire (i.e. the share of the questions), which would have been displayed to the respondent after they had prematurely terminated the survey. For example, if a breakoff occurs after the respondent completed 10% of the questionnaire, then UBL is 0.9 or 90 %. Thus, we have data for the UNL and UBL and we can also calculate the UML:

UML = UBL + (1 – UBL) × UNL = UBL + UNL – UBL × UNL

3. UCL – Unit Completeness Level is complementary to the corresponding value of the UML:

UCL = (1 – UML) = 1 – UBL – UNL + UBL × UNL

If we take the example from the previous point with LBM = 0.9 and assume that the respondent answers to half of the 10% of the responses that were shown to him (UNL = 0.5), then UCL is 0.05 or 5%.

4. UIL - Unit Non-applicability level is calculated by dividing the total number of variables, where the condition (IF) for a given unit is not met (status -2) by the sum of the number of all variables that were shown to this unit and the total number of variables, where the condition (IF) for a given unit is not met. If the survey has 20 questions and the respondent answered 10 questions, and the remaining 10 questions were not shown because the respondent did not satisfy the condition, then the UIL is 0.5 or 50%.

5. UAQ – Unit Additional Questions is calculated by dividing the number of variables that a particular respondent was not shown because they were subsequently added to the questionnaire by the number of all variables. If a survey has 20 variables and we subsequently add 10 more variables, the UAQ for this respondent is 0.33 or 33%.


The functionality is only available for users of the 3KA package for individuals, and for users of the business packages for groups.


Survey Data, Paradata, Identifiers and System Variables

In the 'DATA' - 'Browse' tab, the following data for valid units is displayed by default: status, status details and respondents' answers.

Status

  • Status: the final status of the units.

Status details

  • Empty: shows if the questionnaire is empty (the respondent merely clicked through the survey without answering);
  • Recnum: consecutive record (entry) number;
  • Date: date on which the survey was filled out.

Respondents' answers

  • Respondents' answers (survey data) for valid units.

If you want to see the actual responses in addition to the numerical values of the responses, click on 'Show columns' and tick the 'Response labels' option.

Additional data

If the option 'All units' is selected when browsing the data, or if some units have an email invitation, the following field will automatically appear:

  • Relevance: shows whether an individual unit is valid, where units with statuses 5 and 6 (i.e. fully or partially completed questionnaires) are considered as valid.

In special cases, you can also enable the display of the following information by selecting the relevant check boxes in 'Show columns':

  • Record number, which is generated automatically;
  • Quick view survey: shortcut for viewing an individual respondent's survey answers on one page.

If you have used automatic test entries, the 'Test' column will also automatically appear when viewing the data, indicating whether the unit is a test entry.

Paradata

Paradata is only available for users of the 2KA and 3KA packages for individuals, and for users of the business packages for groups. By selecting 'Respondent paradata' under 'Show columns', the following information is displayed:

  • Date begin: exact date and time (hours, minutes and seconds) when the respondent arrived at the survey homepage (click on the URL of the link to complete the survey);
  • Date end: last time the respondent was active on the survey, excluding the final page;
  • Page 1: exact time when the respondent clicked on "Next page" on page 1;
  • Page 2: exact time when the respondent clicked on "Next page" on page 2;
  • Page n: exact time when the respondent clicked on "Last page" on the n-th page of the survey, where n = the total number of pages in the survey, excluding the outro page;
  • Browser used by the respondent;
  • Browser version used by the respondent;
  • Operating system used by the respondent;
  • Device used by the respondent (PC, phone, tablet);
  • Referrer: the website from which the respondent accessed the survey (redirect);
  • Language: the language in which the respondent answered the survey (in the case of multilingual surveys).

The paradata is shown in the data table on the right (the last columns of the table). If some of the data isn't visible, select the 'All' option from the 'Questions per page' dropdown above the data table on the right hand side.

You can turn off the recording and display of paradata in the 'EDIT' - 'Settings' - 'Paradata' tab, and then no paradata will be recorded in 1KA - not even the timing (response dates) for individual pages. You can turn off the recording of the respondent's browser, the respondent's referrer (redirects) and the dates of answering the questions. More >>

Identifiers

Identifiers are data imported and edited in the 'PUBLISH' - 'Invitations' tab, which is only available to users of the 3KA package for individuals, and for users of the business packages for groups.

Identifiers usually include the name, last name, email, address, etc. For privacy reasons, this information cannot be displayed at the same time as the survey data in surveys, but is displayed separately. With the prior consent of the participants, a common overview, analysis and export is only possible in the Form survey type (one-page survey), where we usually collect registration data, but not survey opinions.

Identifiers are among the system variables that can be used (called) in email communication, i.e. in notifications and sending email invitations. At the same time identifiers allow the identification of each unit. Of course, when editing the questionnaire, in addition to the identifiers, any variable can be marked as a system variable (when editing a question, select the 'Advanced' tab and choose the 'System Variable' option), which allows its use in email communication.

It is not possible to display respondents' IP numbers in the data, as we do not track them and record them separately from the survey data, as defined in our Privacy Policy.


Some of the functionalities described are only available for users of the 2KA and 3KA packages for individuals, and for users of the business packages for groups.


Related content

Your First Survey

After you have successfully registered on 1KA's website, you are able to create your first survey.

1. CREATING A SURVEY

You can create a survey in the 'My surveys' tab by clicking on 'Create Survey'. Choose a name for your survey, which will be displayed in your directory, as well as the name that will be visible when the survey is published (to the respondents) – the names can also be identical. You can also select the primary language for the respondents, i.e. which language the basic options should use (next page, back, end of survey …). In order to create a short survey, click on the option 'Survey'. If you wish to create a form, click on the option 'Form', while for voting you must click on the option 'Voting'.

When you select the desired survey type (Survey), you will be automatically redirected to a page where you can edit the survey, choose from the different types of questions, and later, when you have finished collecting data, can also access the data and the analysis.

To start with, you have the option of setting socio-demographic questions, which are already pre-set in the 1KA tool. These questions are standard and are used in scientific research. The selected demographic variables can be included in the questionnaire by ticking the box next to the desired variables. 1KA positions the selected socio-demographic questions into a separate block at the end of the questionnaire. Each variable comes in various types – you can select the desired question type in the 'Edit question' sub-tab. All possible question types are found in the dropdown menu in the upper right corner of the question editor. Select the chosen type and click 'Close'.

If you don't like the default Introduction, you can simply change it by clicking on the text and enter your own introduction. The introduction should not be too long but should serve to persuade the respondent to complete the survey. For more information on how to effectively write an introduction, consult our recommendations for writing the survey introduction.

Different types of questions are available on the left side of the screen, which can be easily inserted into your questionnaire. If you navigate the mouse over each question type, an example of the question formation is displayed. The questions can then be dragged and dropped to the desired position in the survey, or you can simply click on the question type, and the question will appear automatically at the bottom of the survey.

2. TESTING YOUR SURVEY

The 'TEST' – 'Diagnostics' tab warns you of any possible mistakes and offers recommendations to improve your survey. You can include Comments and Automatic entries in your survey. Comments are only available in the 3KA package. You can test the survey with the test entries icon, which can be found to the left of the survey URL and in the 'PUBLISH' – 'Settings' tab.

3. PUBLISHING YOUR SURVEY

When the survey has been successfully created, click on the 'PUBLISH' tab, where you can activate your survey and access the survey URL. More >>

By clicking on the 'Activate' option, which is found on the left side of the screen, the survey becomes active. A new window will appear; by default, the survey will be active for a period of three months, but the time period can be adjusted in the 'Activities settings can be changed here' optionYou can set the start and end date of the survey activity or choose to make the survey permanent. In addition to the time limit, you can also set a response limit or quota here. More >>

Survey activation is also possible above, to the right of the survey URL, by clicking the OFF button.

4. DATA REVIEW

In the 'DATA' tab, you can review the collected data, and can also review the answers for each individual unit with the 'Insight' option. By default, only valid units (i.e. units where the questionnaire was partly or fully completed) are displayed. The collected data can be exported in text format or into SPSS and Excel. Data export is only available to 2KA and 3KA private package users. More >>

5. OVERVIEW OF ANALYSIS

The 1KA tool merely generates tables according to the chosen question type. In the 'ANALYSE' – 'Statistics' tab, only basic statistical analyses are displayed, such as frequency, percent, number of units, etc. 2KA and 3KA private package users also have the option of advanced analysis. More >>

The 'ANALYSE' – 'Charts' tab allows access to the graphic presentation of data. Charts are only available to 2KA and 3KA private package users. The chart type is selected based on the question type, which you can also change. The colour of the charts can also be modified. More >>


Related content

Granting Survey Access to 1KA Helpdesk

Protecting user data is one of 1KA's top priorities. Access to data is limited to the author (editor) of the survey and additional co-editors, which are added by the author of the survey.

1KA's helpdesk and the website administrator of www.1KA.si do not have access to surveys and data without the explicit consent of the user.

In case the user requires assistance from 1KA’s administrators, the user must grant temporary access to 1KA's helpdesk (until the issue is resolved). Despite granted access, administrators are still committed to the highest standards of privacy protection, as defined in the Terms of Use.

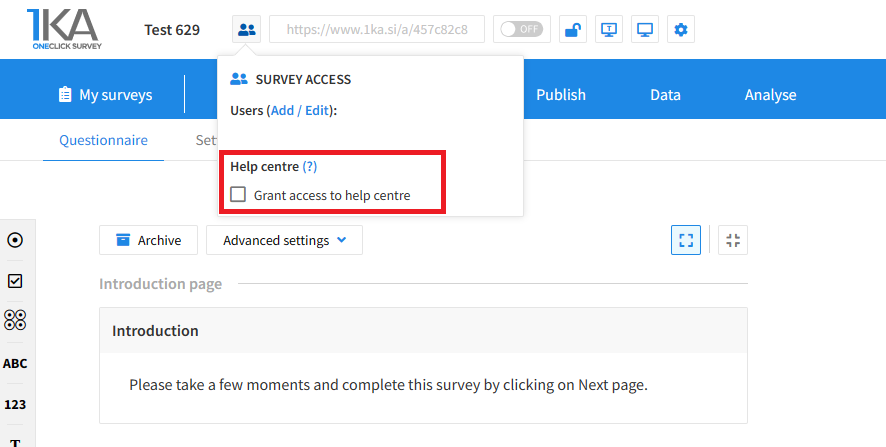
Each survey has an icon in the top left corner which enables you to grant access to 1KA's helpdesk and administrators. You have to click 'Grant access to help centre'.

Grant access to help centre
 

The author can add co-editors in the tab 'EDIT' – 'Settings' – 'Editor access'.

Related content

1KA is free to use for basic users